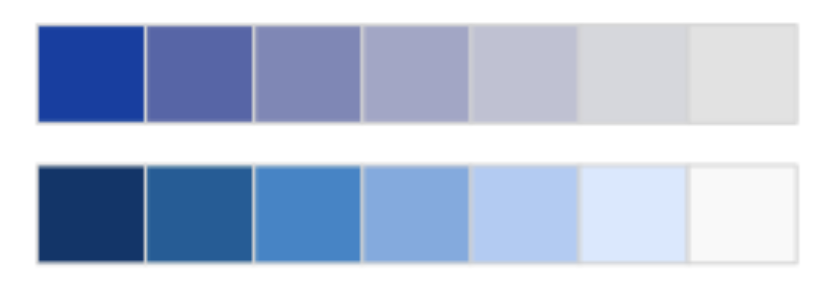
3.4.0.3 Primary colors (Categorical)
|
Blue #4A85A3 |
Muted orange #E3965A |
- See Appendix I.
- Demo with
charttypes-workbook
week2.zip file from at rforir.com/classes/tableau_oct24.html.week2 in your class folder.week2 folder.student_activity.csvstudent_activity_output.hyperstudent_activity_in_class-flow.tflwide_in_class_wk2.csvgrades_wk2_inclass.csv
student-monitoring.csvstudent-monitoring-in-class-flow.tflcharttypes-workbook.twbIt would make sense if you had this in the same subdirectory as your week1 folder. But no big deal if it’s not.
Prep Builder to import, clean, and export dataSee App. D (for the template) and App. E (for an example).

|
Green #6A9F58 |
Yellow #D9B650 |
Red #D35F5F |
|
Dark Gray #303030 |
Medium Gray #b3b3b3 |
|
Blue #4A85A3 |
Muted orange #E3965A |
charttypes-workbook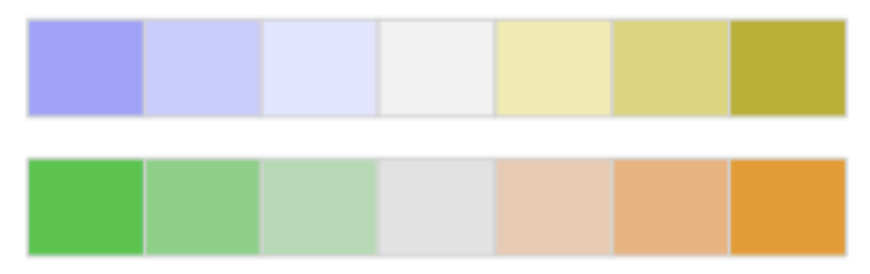
Notes
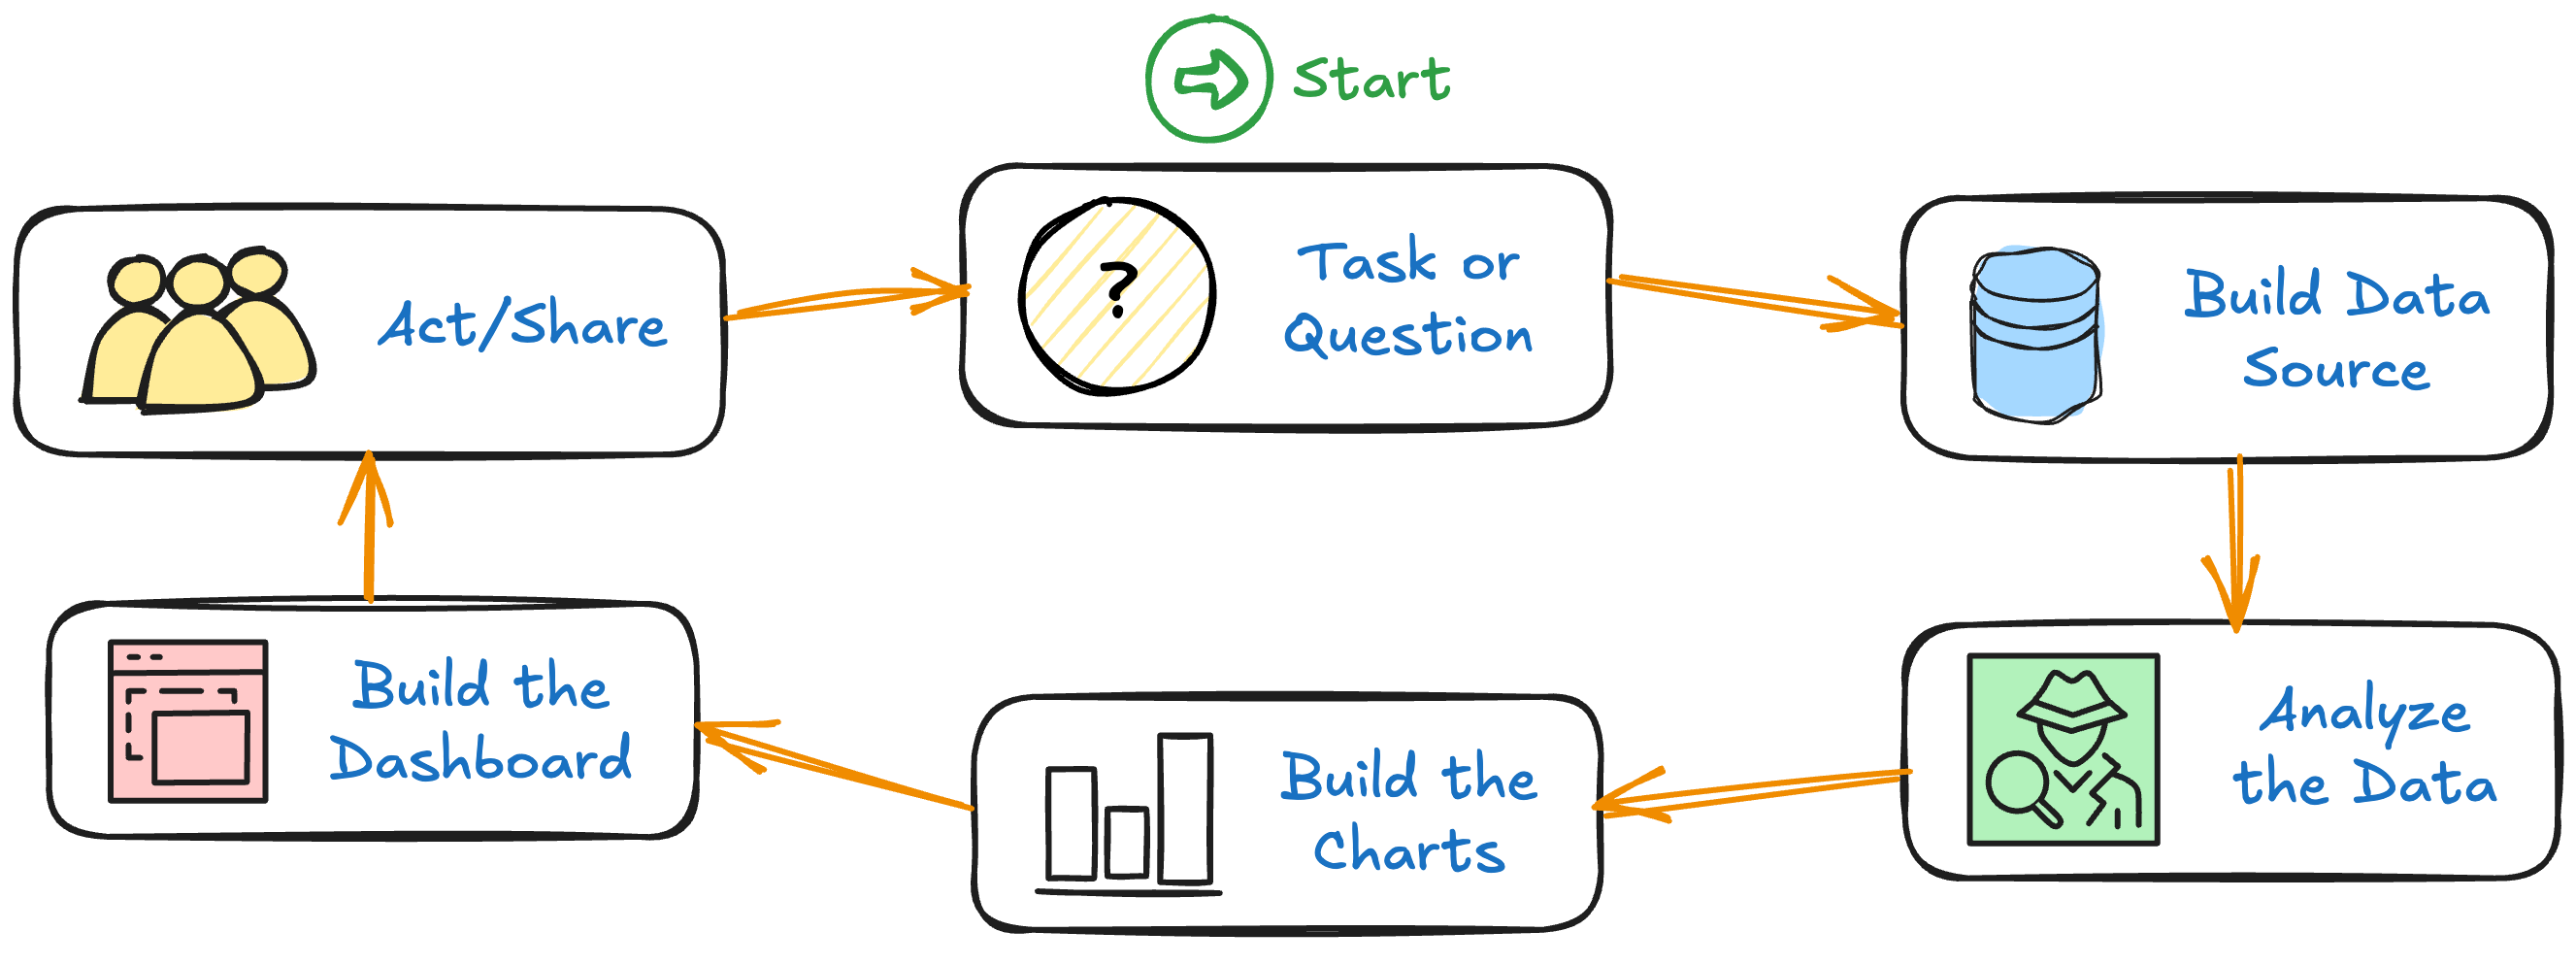
Prep Builder to import, clean, and export dataPrep Builder capabilities
Prep Builder flowDiscussed & demonstrated in Sections 2.3 & A.3.4.

Go through the actions in Appendix A.3.4.
Prep Builder flowTableau Prep BuilderOpen a Flow buttonstudent_activity_in_class_flow.tfl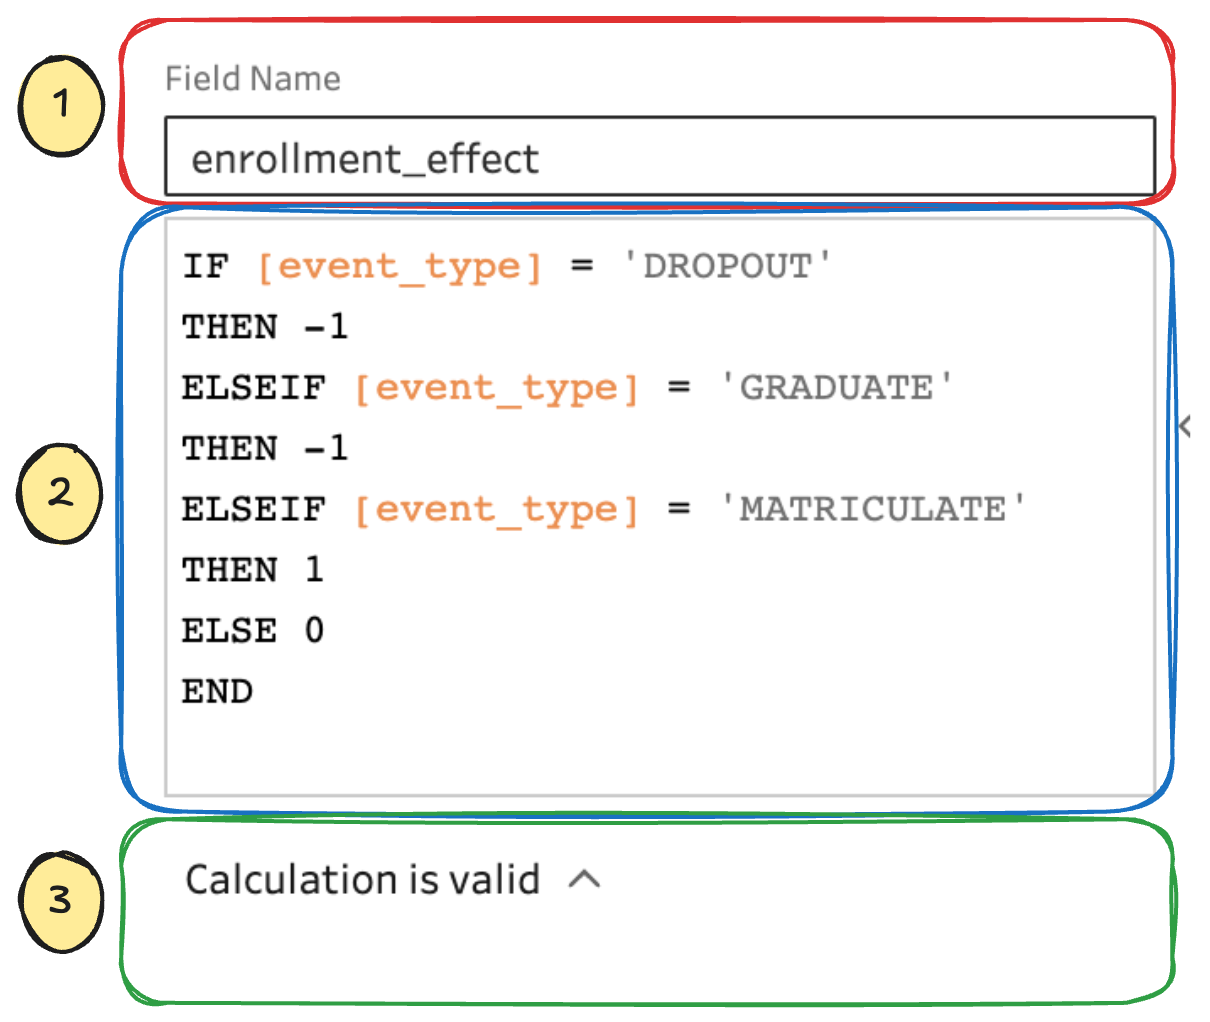
IF-THENNotes:
comparison failsIF-THEN-ELSEIF-THEN-ELSEIF-ELSEPrep Builder flowuniv_gpa and hs_gpahome_stateevent_term_name and admit_term_namestudent_id)IF [hs_gpa] <= 4.0
THEN [hs_gpa]
ELSE 4.0
ENDIF [univ_gpa] <= 4.0
THEN [univ_gpa]
ELSE 4.0
END[event_season] + " " + STR([event_calendar_year])[admit_season] + " " + STR([admit_calendar_year])Get rid of student_id
enrollment_effect near event_type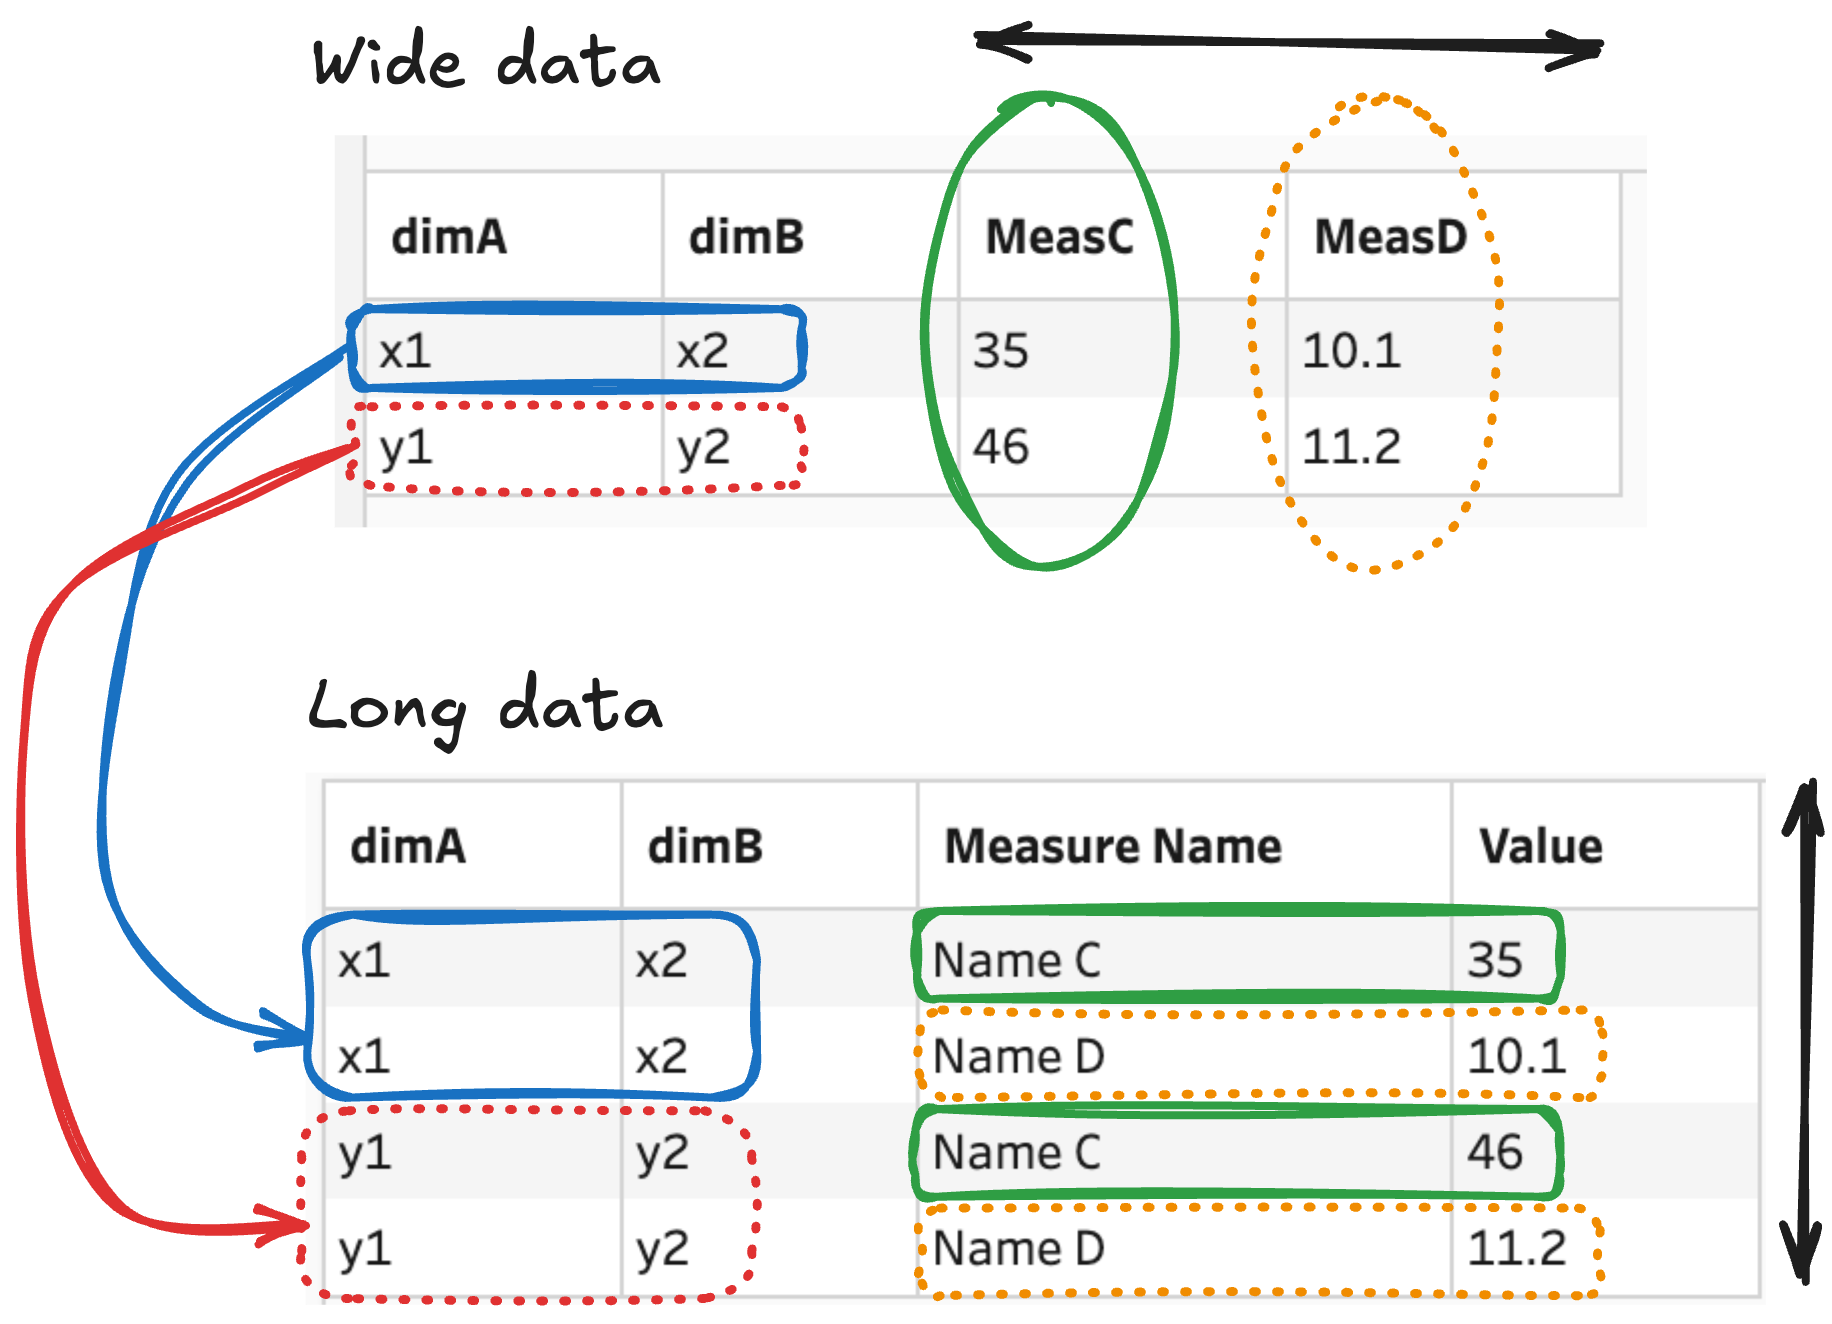
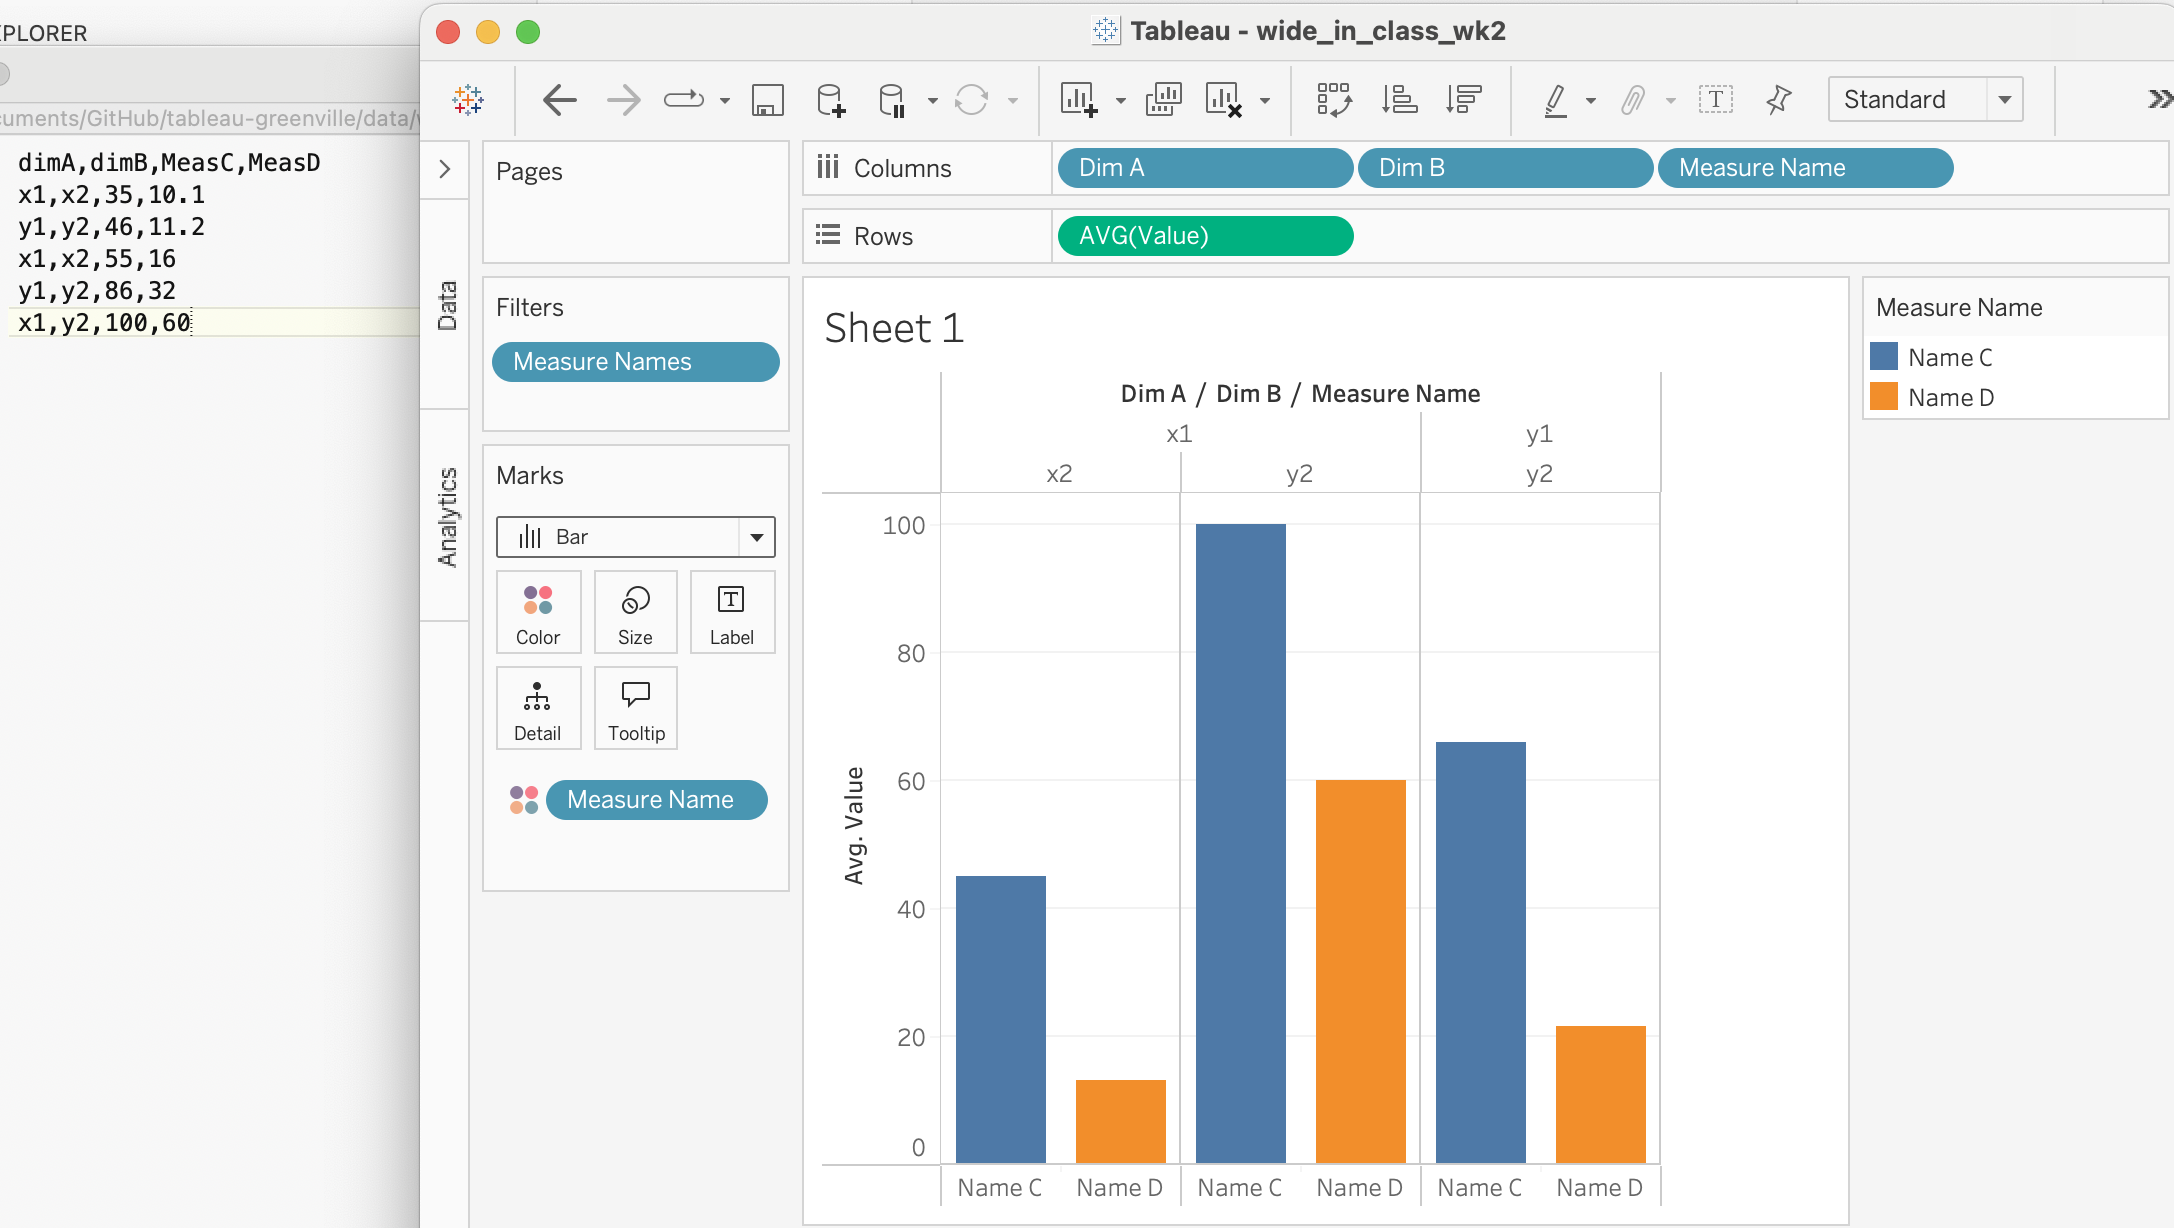
Prep Builderwide_in_class_wk2.csvwide_to_long_in_class.hyperPrep Buildergrades_wk2_inclass.csvgrades_wk2_long.hyperstudent_monitoring.csv in a spreadsheetstudent_monitoring-in-class-flow.tfl in Prep BuilderIn a data worksheet that you have, can you recognize wide data?
We’re going to be working with charttypes-workbook.twb for the rest of the class.
Let’s talk about your projects/dashboards:
Speaker notes go here.
Removed now that the class is over.