1 Assembling & Sharing the Dashboard
Before today’s class
- Download
week4.zipfile from at rforir.com/classes/tableau_oct24.html. - Make a folder
week4in your class folder. - After extracting the files from the ZIP file, drag them to the
week4folder.
2 Overview
2.1 Today’s class
- Assembling the dashboard
- Sharing the dashboard
- Question & Answer time
- Note
-
We are simply working through beginning with the file containing the graphs we were working on last week.
3 Assembling the dashboard
3.1 Dashboard Project Document (review)
- Who use
- Why need
- What metrics
- How use
- When
- What is success?
- Charts
- Sketch of the charts
- Limit the information
- Dashboard design
- Structure
- Interactions & filters
- Also: Colors
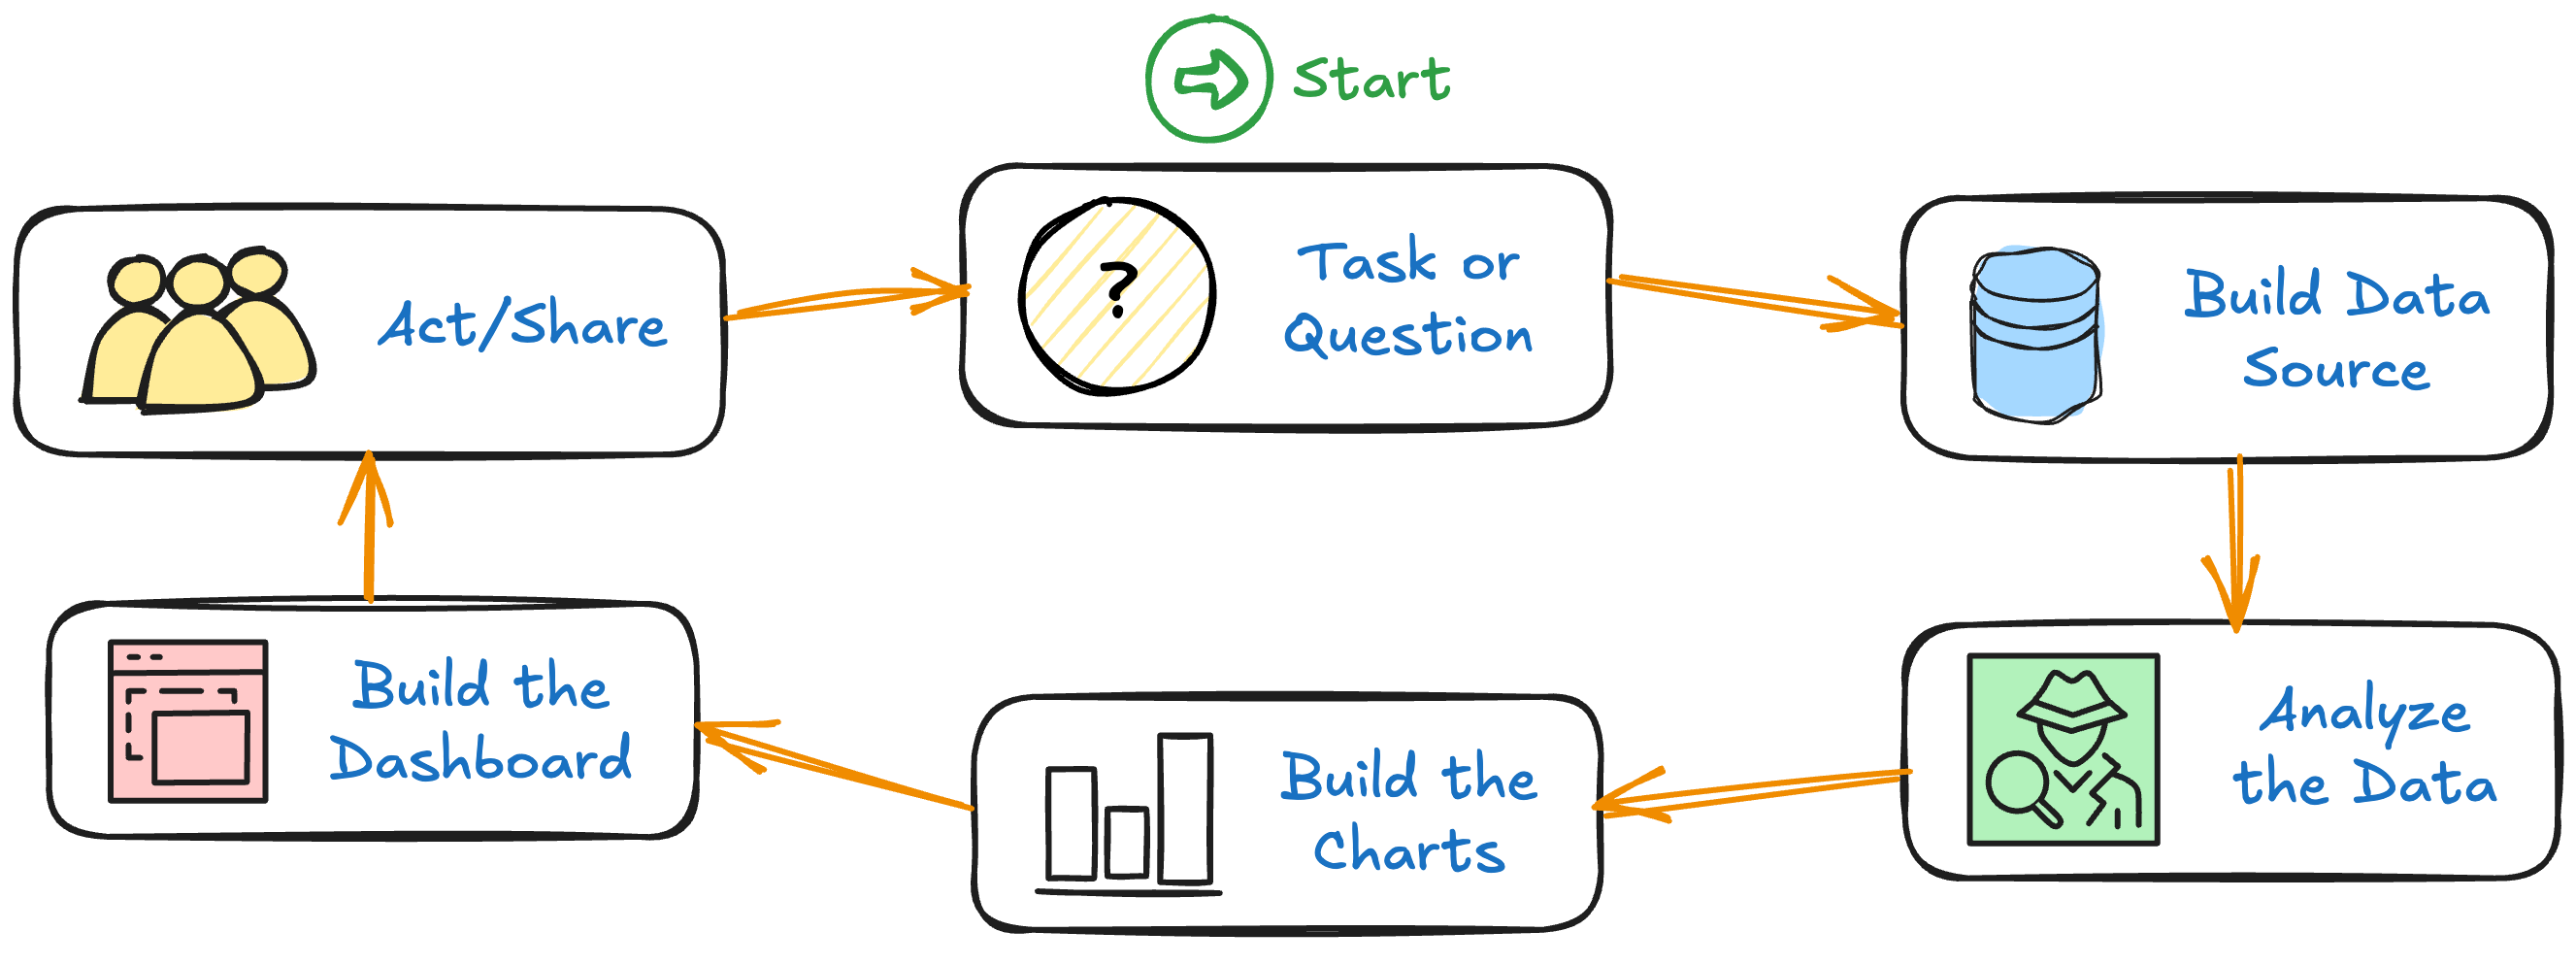
3.2 Dashboard Build process
- Draw the container structure
- Create the dashboard object
- Build the container structure
- Add content
- Format the dashboard
- Format the floating container
4 Going through the Dashboard Building process
4.1 0) Open Tableau
- Open up Tableau Desktop
Connect to a File->More...->Tableau Workbooks->week4-in-class-start.twb- Click
Open
4.2 1) Draw the container structure
4.3 2) Create the dashboard object
- Click the
New Dashboardtab - Rename it to “Test Dashboard”
- Set Dashboard Size to Automatic
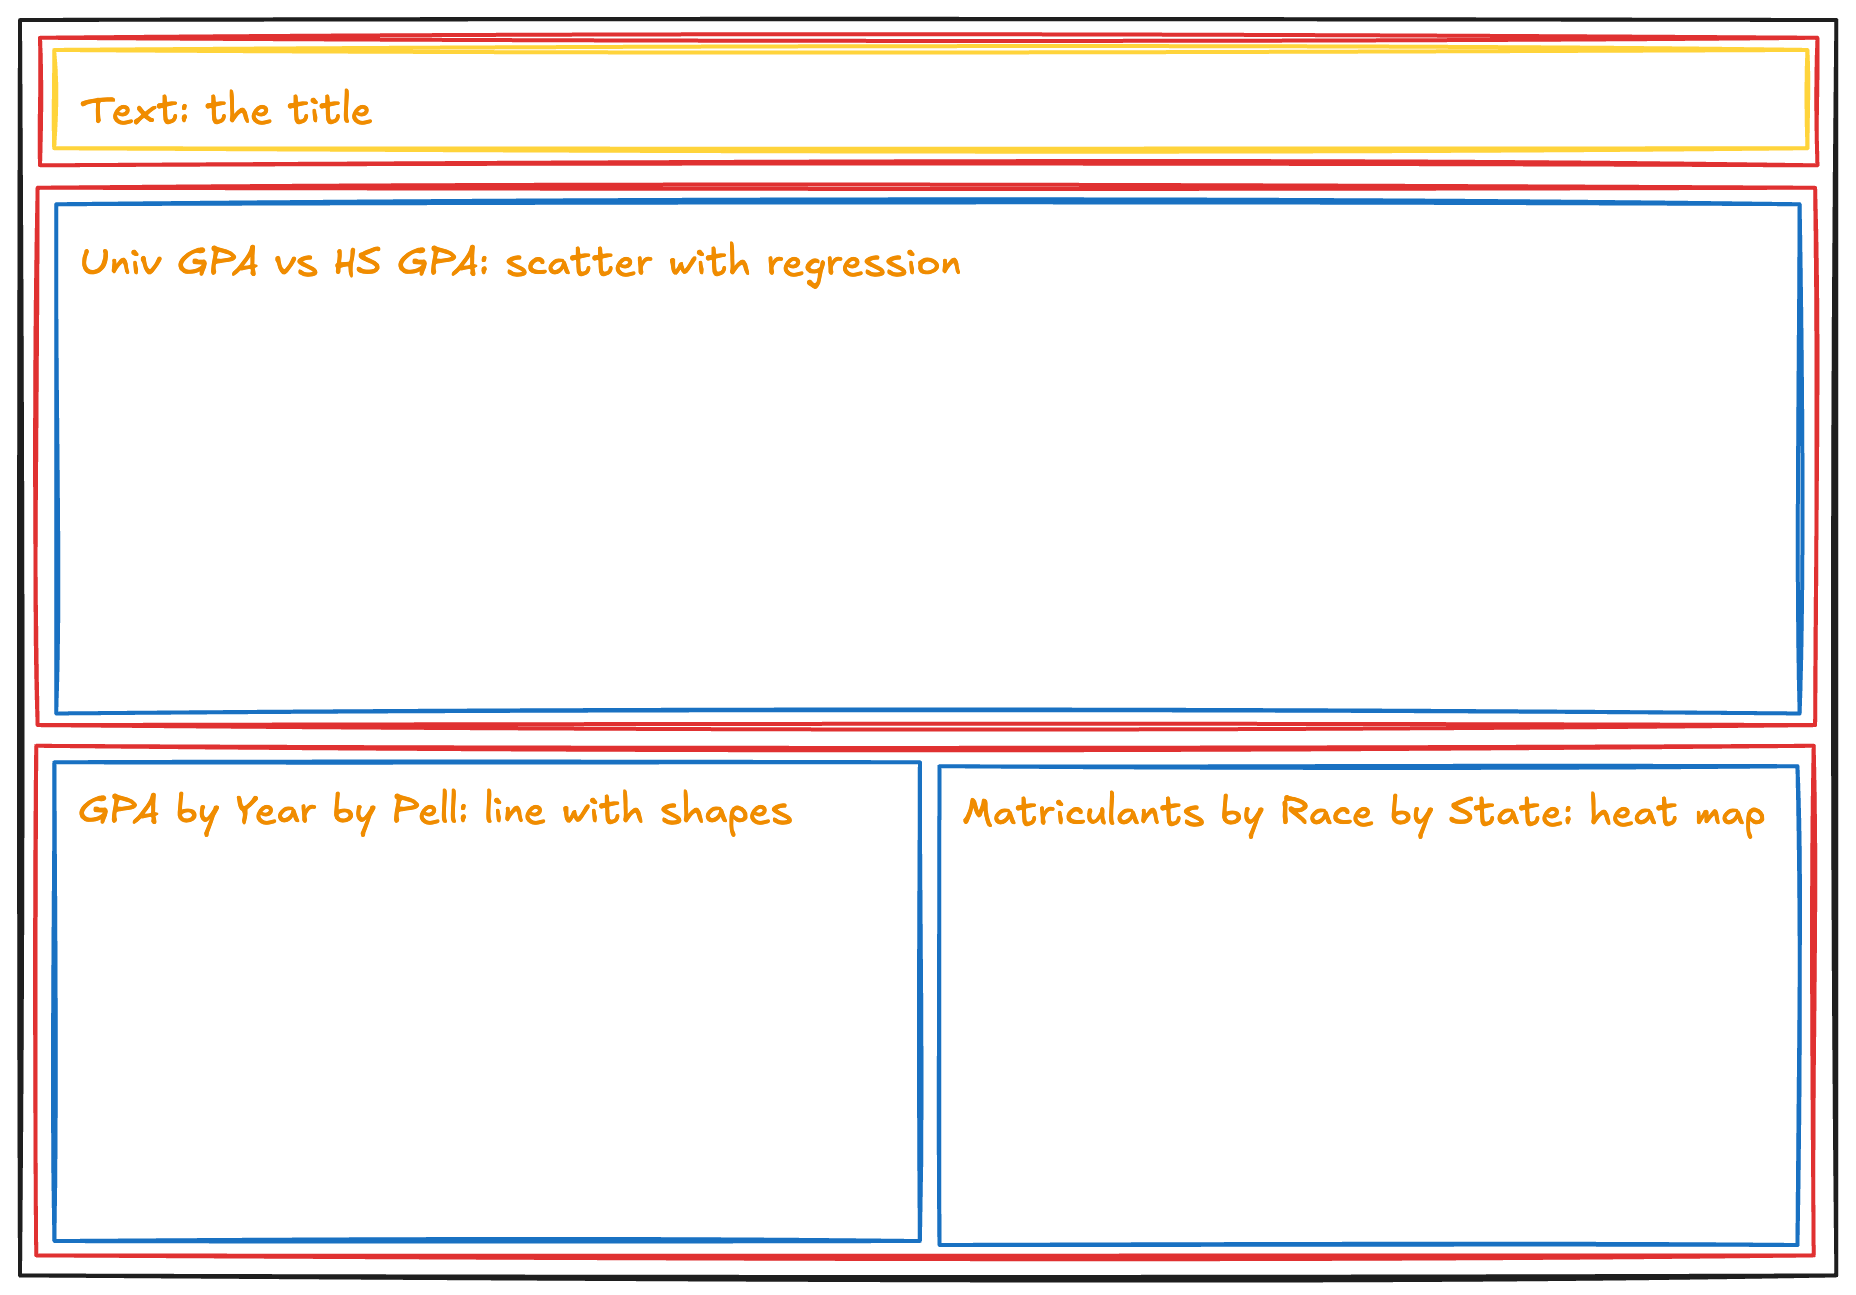
4.4 3) Build the container structure
- Drag a Vertical/Tiled container
- Name it “Main Vert”
- Drag a Horizontal/Tiled container within it (“Title Horiz”)
- Drag a Text within it (“Test Dashboard”, Tableau Bold 20)
- The size of “Title Horiz” should be small
- Drag a Horiz/Tiled container within “Main Vert” (“Btm Chart Horiz”)
- Drag “GPA by Year by Pell” into it
- Drag “Matriculants by Race by State” to the right of the other graph
- Drag a Horiz/Tiled container within “Main Vert” (“Top Single Horiz”)
- Drag “Univ GPA vs HS GPA” into it
- Drag to resize for now
4.5 4) Add content
Done.
4.6 5) Format the dashboard
- Distribute the content of “Btm Chart Horiz”
- Add spaces around charts
- Inner Padding: 7
- Outer Padding: 10
- Add missed filters
- “AP Course Level”
- “Income Level”
4.7 6.1) Format floating container
- Drag “Gender” to top
- Apply to All Using this Data Source
- Remove duplicate Gender filters
- Drag “Minimum Year” below Gender
- Drag “Text” right below Gender (“Univ vs HS”; Tableau Bold 12, Dark Blue)
- Drag “Text” right below that (“All charts”; Tableau Bold 12, Dark Blue)
- Drag “Text” below that (“GPA by Year”; Tableau Bold 12, Dark Blue)
- Drag “Text” below that (“Matriculants”; Tableau Bold 12, Dark Blue)
- Put all in order
4.8 6.2) Format floating container
- Select the Vertical container with legends and filters
- Name it “Floating”
- Convert it to Floating
- Give it a White background and Black border
- Drag the bottom so that it is big enough to show everything
- Add
Show/Hidebutton- Drag it to appropriate position
- Save file
- Go into “Presentation Mode”
- Play with
Show/Hidebutton
- Play with
6 Wrap-up
6.1 Your questions
What questions do you have?
6.2 Class survey