Institutional Data: A Call to Action
1 Introduction
As professionals whose work lives have revolved around data for more than four decades each, we have observed the need and ability to manipulate vast quantities of data move from a limited back-room cadre of powerful but hidden professionals to nearly the entire extent of an institution’s workforce. This transition has had great benefits but has brought with it many practices that contribute neither to the institution’s success nor to the effectiveness or productivity of staff or faculty members. We propose a method of storing, manipulating, and using data that has would have extensive benefits to — and minimal costs for — a wide variety of institutions.
2 Background
In an era when data touches every part of an institution’s operations, making the most of it is essential for thriving in a challenging and competitive environment. Our proposal builds on years of experience and research, aiming to help institutions harness the power of data to boost both efficiency and effectiveness. Let’s look at a few foundational concepts — efficiency, effectiveness, data science, and metascience — and how they shape a smarter approach to data. (See Figure 1.)
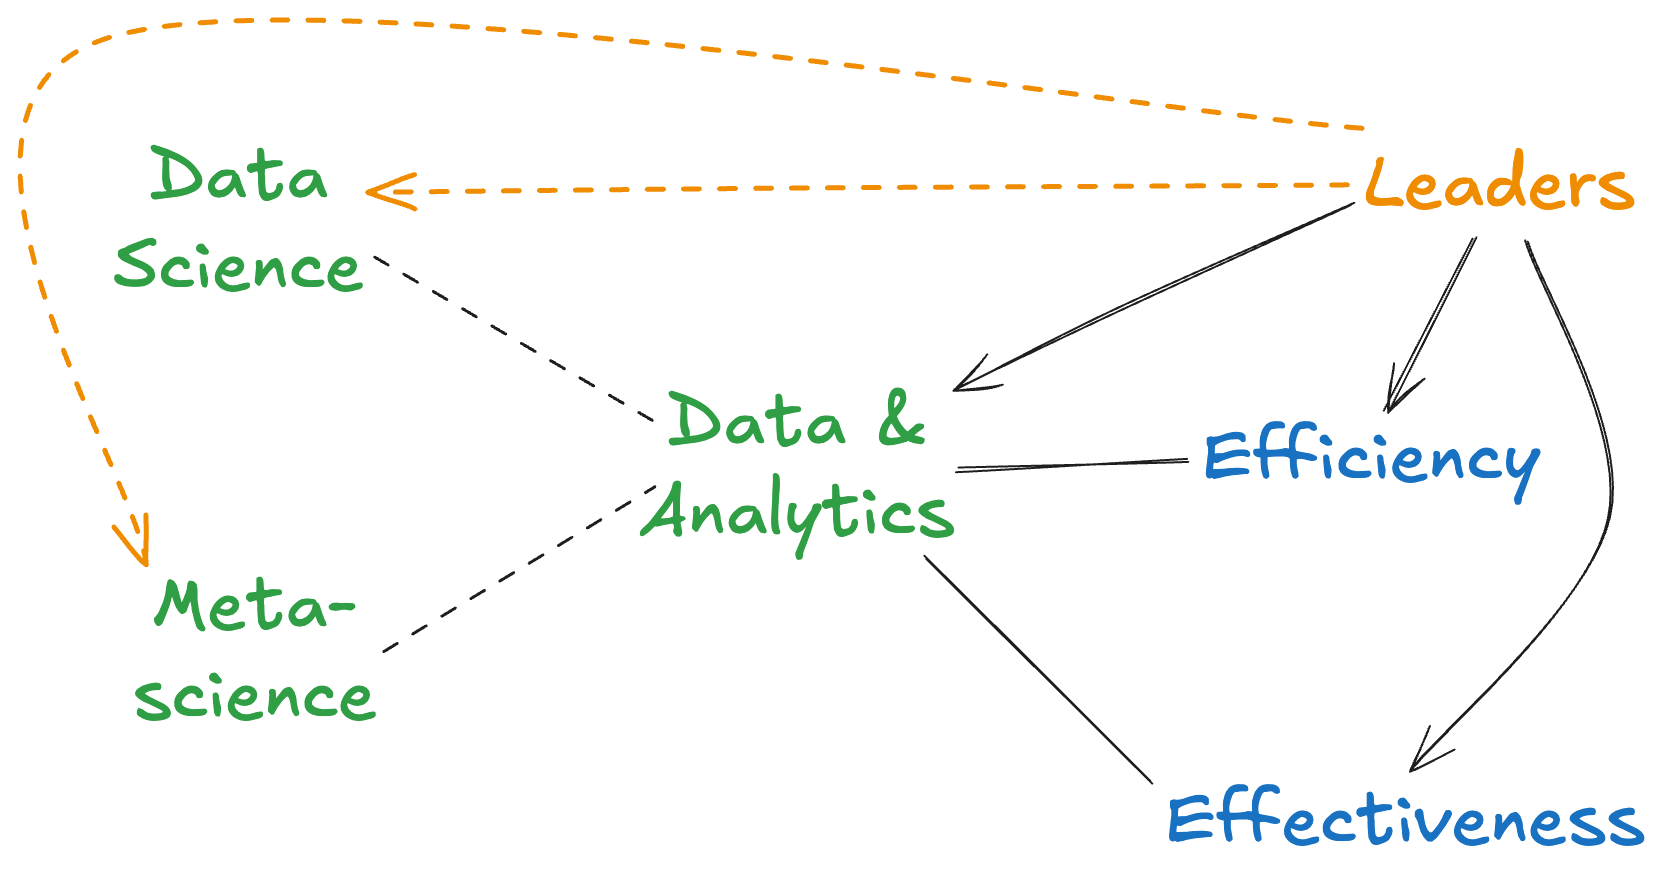
As one recent article notes, institutions “must strike the right balance between driving for efficiency and achieving effectiveness while also supporting employees to balance work and life in meaningful ways.”1 In other words, colleges and universities today aren’t just looking to cut costs — they’re aiming to make every effort count in a way that supports both the institution’s goals and employee well-being. Data offers a way to do just that, as it empowers employees to do more valuable, engaging work by automating repetitive tasks and uncovering insights that drive smarter decisions.
It’s no secret that data is critical to institutional success. Studies confirm that data can “improve efficiency and productivity, achieve more effective decision making, and drive better financial performance.”2 Leaders already know that data can be a powerful asset. Our proposal provides a way for institutions to leverage data even more strategically, allowing staff and administrative leaders to be both more productive and more impactful in their roles.
Data science is all about finding actionable insights hidden within data—insights that guide decisions and support long-term planning.3 In many ways, data science is about becoming detectives of the digital world, looking for patterns and relationships in data that lead to better outcomes. This approach is valuable across an organization, from operations to marketing and finance, and it’s accessible to any team member willing to learn.
Another core principle guiding our approach is metascience—the study of science itself. Metascience seeks to make the process of knowledge accumulation as efficient and effective as possible.4 Data scientists, in essence, are metascientists at heart: they want data to be reliable, insightful, and actionable. This mindset encourages every employee to engage with data thoughtfully, asking not only what the data shows but also how it can be best applied to serve the institution’s mission.
Data doesn’t just serve a handful of specialists anymore; it’s a critical resource for nearly everyone in a college or university. By empowering staff and administration to become savvy users of data, leaders can create a culture that values continuous learning, creativity, and meaningful impact.
3 Recommendations
We begin to develop our recommendation by introducing the concept of reproducibility, a significant focus of metascientists:
“[R]eproducibility is obtaining consistent results using the same input data; computational steps, methods, and code; and conditions of analysis.”5
This concept forms the basis of all that is to follow.
Our recommendations emphasize three key areas that institutions should target to achieve greater reproducibility in their data workflows: isolating data as input, structuring explicit computational steps and methods, and integrating analysis with background information. These practices build efficiency by eliminating ambiguity, making processes transparent, and enabling repeatable workflows that empower employees to focus on strategic work.
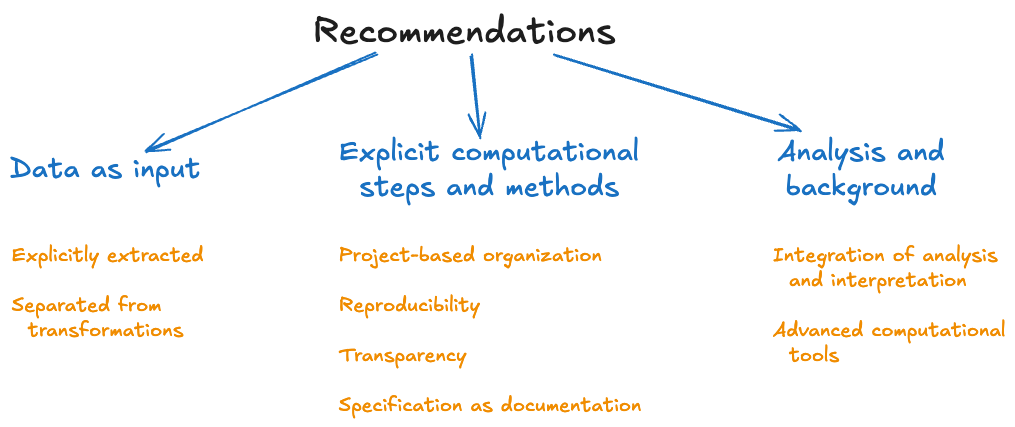
3.1 Data as input
For an efficient and reproducible data workflow, data should be treated as a stand-alone asset, distinct from the computational and analytical steps that act upon it. This separation of data from analysis is crucial for ensuring that input data remains a consistent, reliable foundation for any process.
- Explicitly Extracted
- Institutions often blend data manipulation directly within tools like Excel, blurring the line between raw data and analysis. Instead, data should be extracted and saved in its raw form before any transformations occur. By maintaining an explicit extraction process, staff and administration can trace back to the original data source and verify inputs at any point in the workflow.
- Separated from Transformations
- All data transformations, whether filtering, aggregating, or reshaping, should occur separately from the input data file. By writing transformations as distinct, documented processes, analysts can recreate the final dataset reliably and check each transformation step for accuracy, which also serves as an invaluable troubleshooting tool.
3.2 Explicit computational steps and methods
Adopting a project-based organization for all analytical activities can streamline and formalize the entire analytical process. When analytic work is structured as discrete, organized projects, with data, code, and documentation housed within dedicated subdirectories, it becomes easy to manage and reproduce.
- Project-Based Organization
- Each analysis should be treated as a standalone project. This means establishing a dedicated folder for every project that includes subfolders for data, code, outputs, and reports. By creating these project structures, employees ensure that each analysis is isolated and self-contained, which improves both reproducibility and handoff to other team members.
- Reproducibility
- When processes are documented as repeatable steps, it becomes easier to execute them without error, regardless of the complexity of the analysis. Automated scripts or programs should perform data transformations, run analyses, and produce output reports, allowing employees to reproduce results as needed with minimal manual intervention.
- Transparency
- A reproducible workflow allows each intermediate step in the analysis to be easily inspected. This visibility helps employees quickly identify errors, refine analyses, and make continuous improvements. Additionally, transparency in the workflow makes it easier for new team members to understand the process.
- Specification as Documentation
- Each computational step not only describes what actions need to be taken but also serves as documentation. When new team members join or when projects are revisited months later, having this clear specification ensures that the work can be interpreted and continued seamlessly.
3.3 Analysis and background
For a data workflow to provide meaningful insights, it must be integrated with analytical context and supported by robust tools that streamline advanced computations. Combining computational outputs with interpretive narratives ensures that the work resonates with institutional stakeholders.
- Integration of Analysis and Interpretation
- Data displays and computational outputs should be presented alongside explanations and interpretations, helping faculty, staff, and administrative leaders understand the analysis context. This combined approach avoids the all-too-common issue of data being presented without sufficient context, which can lead to misinterpretation.
- Advanced Computational Tools
-
College staff often overlook advanced tools that can enhance statistical analysis, yet industry-leading tools are now accessible even to non-technical users. Tools such as
RandPython, which integrate easily with databases, provide powerful means to conduct statistical analysis, enabling employees to perform complex analyses and visualize results effectively.
These recommendations not only streamline data workflows but also foster a culture where reproducible practices become embedded in daily operations, ultimately enhancing both employee productivity and organizational decision-making capacity.
4 Effects
Implementing reproducible practices within an organization’s data workflows leads to transformative impacts across multiple areas. Here, we detail five critical areas where reproducibility enhances organizational performance.
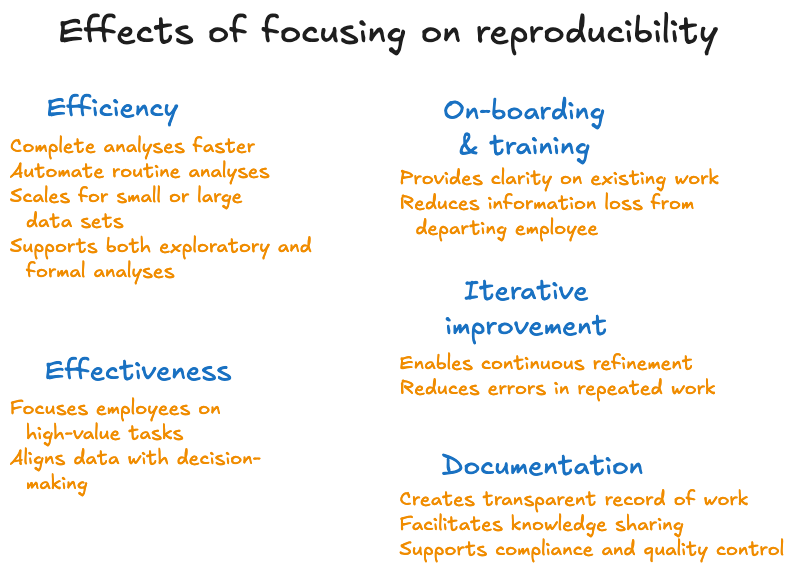
4.1 On efficiency
Efficient use of data resources enables institutions to quickly respond to changing conditions, streamline daily operations, and make better use of staff time.
- Complete Analyses Faster
- By creating clear, repeatable steps and automation for common processes, analyses can be completed in less time. A reproducible workflow, where data and computations are cleanly separated and organized, reduces the time spent on manual adjustments or re-checking data, allowing analysts to complete tasks more rapidly.
- Automates Routine Analyses
- Once a reproducible pipeline is in place, routine analyses can be automated, freeing staff and administrative leaders to focus on more complex and strategic tasks. For example, quarterly performance reports or routine data summaries can run on schedule without requiring manual intervention.
- Scales for Small or Large Data Sets
- Reproducibility practices, especially those utilizing programming languages and databases, can handle both small and large data sets with ease. This scalability ensures that as data volumes grow, processes remain robust and employees do not face new bottlenecks.
- Supports Both Exploratory and Formal Analyses
- Whether the goal is rapid exploration of new data or creating a highly-polished report, reproducible workflows support both needs. Exploratory analysis benefits from repeatable steps that quickly test different approaches, while formal analyses can be verified, documented, and easily replicated.
4.2 On effectiveness
Effective data practices enable staff and administration to focus on the substance of their work, making decisions based on clear, reliable information.
- Focuses on High-Value Tasks
- When repetitive tasks are automated, staff and administration can concentrate on identifying insights and making decisions that matter. Reproducible workflows remove much of the “data wrangling” burden, allowing institutional analysts to spend more time interpreting results and less time preparing data.
- Aligns Data with Decision-Making
- With data processing steps well-documented and integrated with interpretive context, decision-makers gain confidence in the accuracy and relevance of the data presented to them. They can make better-informed choices based on insights that are transparent, reproducible, and aligned with institutional goals.
4.3 On on-boarding & training
Clear documentation and reproducible workflows make onboarding new staff smoother and reduce the time needed for training.
- Provides Clarity on Existing Work
- New staff or administration members taking over a project benefit from the documentation and structured workflows that reproducibility practices provide. Rather than piecing together undocumented procedures, they can quickly understand the structure of existing reports and analyses, reducing time spent on onboarding.
- Reduces Information Loss
- As staff members move to new roles or leave the organization, reproducible workflows help retain knowledge. When data workflows and analyses are transparent and documented, the organization minimizes the risk of losing critical information when a person departs.
4.4 On iterative improvement
Iterative improvement is essential for refining institutional processes, improving data accuracy, and ensuring that insights continue to align with current goals.
- Enables Continuous Refinement
- When a reproducible process is in place, each iteration builds on the last, allowing for incremental improvements rather than repeated re-creations. This enables the team to fine-tune analyses, incorporate new insights, and ensure that outputs are as accurate and effective as possible.
- Reduces Errors in Repeated Work
- Repeating analyses from scratch for each reporting cycle introduces opportunities for error. With a reproducible pipeline, these risks are minimized, as staff can use a tested workflow each time. This stability enables teams to focus on enhancing the analysis instead of troubleshooting issues or reinventing processes.
4.5 On documentation
Effective documentation, a natural byproduct of reproducible workflows, provides lasting value by capturing and communicating the details of data practices.
- Creates Transparent Records
- Reproducible workflows inherently create a record of every step taken. This transparency supports not only internal audits and reviews but also external reporting and compliance, offering clear evidence of how conclusions were reached.
- Facilitates Knowledge Sharing
- When processes are well-documented, they are easier to share with colleagues or stakeholders. Documentation serves as a resource for anyone involved in or affected by the analysis, fostering collaboration and a shared understanding of data practices.
- Supports Compliance and Quality Control
- Documented workflows are essential for compliance with regulatory or education standards. Organizations can more easily verify and validate processes, ensuring that they meet quality standards and that analyses can withstand external scrutiny.
These effects illustrate how reproducibility drives improvements across various facets of institutional performance, from operational efficiency to strategic impact. Implementing reproducible practices positions colleges and universities to make the most of their data, enabling them to act with confidence and agility.
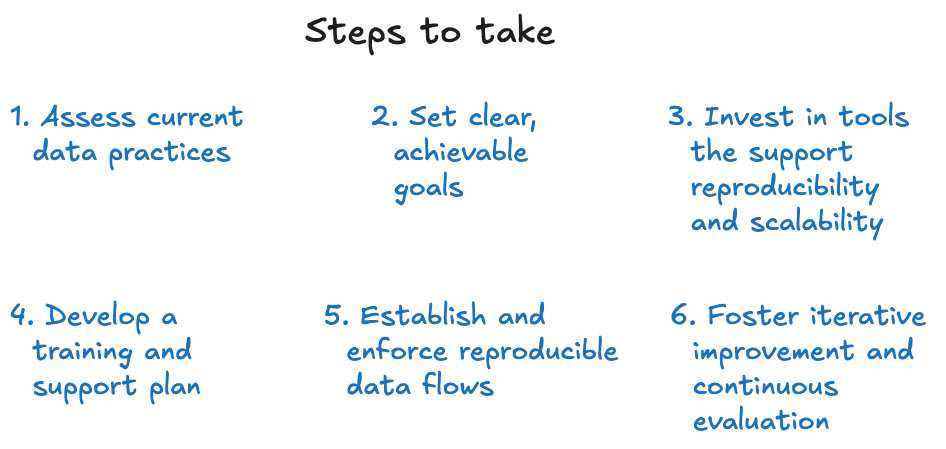
5 Steps to take
Leaders in education play a vital role in fostering an effective, data-driven culture at their institution. Moving from an Excel-dominated approach to a reproducible, structured data environment is a transformation that requires vision, investment, and guidance. Below, we outline a roadmap that leaders can use to initiate and sustain this shift, helping their college or department become more efficient, adaptive, and effective in using data.
5.1 Assess Current Data Practices
- Survey Data Use Across the Institution
- Begin with a comprehensive understanding of how data is currently used by different teams. Identify where data is stored, how it’s shared, and what analyses are conducted (in Excel or otherwise).
- Identify Key Pain Points
- Ask employees about their challenges with data. Are they spending a lot of time on repetitive tasks? Do they struggle with version control? Understanding these issues can help tailor a path forward.
Outcome: Gain a baseline understanding of current data practices, pain points, and training needs, which will inform the institution’s data roadmap.
5.2 Set Clear, Achievable Goals
- Define Short-Term and Long-Term Objectives
- Set initial goals, such as reducing the time spent on routine analyses, improving data consistency, or building a basic data storage system. Long-term goals may include implementing automated reporting, creating centralized data storage, and fostering reproducible practices. This approach doesn’t need to be adopted all at once; it can be implemented gradually, department by department or even project by project, allowing teams to adapt and refine practices incrementally.
- Identify Metrics for Success
- Select measurable metrics to track progress, like time saved on reports, error rates in data analysis, or the number of automated processes implemented. These metrics will provide evidence of the project’s benefits over time.
Outcome : Establish a structured vision and measurable goals that staff and administration can rally around, setting a clear direction for data improvements and enabling the organization to grow into this new approach step by step.
5.3 Invest in Tools that Support Reproducibility and Scalability
- Prioritize Accessible, Open-Source Tools
-
Invest in affordable, robust tools like
RandPostgreSQLthat are widely used for data analysis and reproducibility. Free tools can minimize budget constraints and offer extensive online support and resources (see Appendix). - Encourage Database Use Over Spreadsheets
-
Consider setting up a centralized database (e.g.,
PostgreSQL) for data storage. Databases provide more scalability, security, and ease of access than Excel, enabling teams to work with larger data sets and reduce versioning issues. - Pilot User-Friendly Tools for Analytics
-
For organizations with limited technical expertise, start with tools like RStudio for
RandQuartofor reproducible documents and reports. Training employees to use these tools gradually can build comfort and proficiency.
Outcome: Lay the groundwork for reproducible, scalable data practices with tools suited to the organization’s current and future needs.
5.4 Develop a Training and Support Plan
- Identify Key Staff for Initial Training
- Begin with a small, dedicated team willing to test new tools and workflows, as this approach can allow for gradual scaling.
- Provide Access to Quality Learning Resources
-
Share accessible online resources, such as free books on
R, Coursera and DataCamp courses, or interactive platforms likeswirlforR. Encourage employees to participate in courses and explore these resources in their own time. - Create a Culture of Continuous Learning
- Offer regular sessions where team members can share what they’ve learned, ask questions, and collaborate. Establishing a supportive learning environment will foster continuous improvement and build confidence in new data practices.
Outcome: Ensure employees are well-supported as they transition to new data tools, which will enhance adoption and skill development across the organization.
5.5 Establish and Enforce Reproducible Data Workflows
- Implement Standardized Workflows
- Create simple guidelines on how data should be stored, processed, and analyzed. Encourage project-based organization, where each analysis has a dedicated folder structure and standardized documentation.
- Emphasize Version Control
-
For organizations new to version control, introduce simple version-tracking practices, such as saving script versions with descriptive names or using
Gitfor more advanced version management as employees become comfortable. - Encourage Regular Documentation
- Require employees to document steps taken in their analyses. This not only aids reproducibility but also makes it easier for others to understand and replicate the work. Documentation should be concise and capture key steps, inputs, and outputs.
Outcome: Create a culture of transparency and reproducibility that allows any analysis to be understood, checked, and improved by others in the organization.
5.6 Foster Iterative Improvement and Continuous Evaluation
- Build Feedback Loops
- Regularly review the impact of new workflows and tools with staff and administration. Use feedback to refine processes, address challenges, and make incremental improvements.
- Highlight and Celebrate Successes
- Share examples of how the new practices have saved time, improved accuracy, or enabled better decision-making. Celebrating these wins will reinforce the benefits of reproducible data practices.
- Iterate on Goals and Expand Use Cases
- Revisit the institution’s data goals periodically. As staff and administration grow more comfortable with new practices, consider expanding use cases to more complex analyses or automating additional processes.
Outcome: Encourage a cycle of continuous improvement that strengthens data practices over time, allowing the institution to evolve alongside its goals and challenges.
By following this roadmap, leaders can guide their institution from ad hoc data practices towards a more structured, reproducible, and scalable approach. This transformation not only enhances efficiency and accuracy but also enables staff and administrative leaders to engage more deeply in analytical work, creating lasting value for the organization.
This roadmap aims to be a practical and actionable guide, balancing immediate improvements with long-term growth.
6 Conclusion
In this paper, we’ve highlighted how colleges and universities can greatly benefit from adopting reproducible, structured data practices. By moving beyond ad hoc analyses in Excel and investing in reproducible workflows, leaders can foster a data culture that enhances both efficiency and effectiveness, making it easier for teams to produce reliable insights, reduce errors, and focus on strategic, high-value work. With tools and resources now more accessible than ever, this transformation is within reach for institutions of any size.
For academic leaders, this journey doesn’t have to be daunting. Start by assessing current practices, setting achievable goals, and selecting open-source tools that suit your team’s needs. Encourage small, steady steps toward reproducibility, celebrating each improvement and learning along the way. Over time, these changes will build momentum, creating a lasting impact on the institution’s performance and decision-making capabilities.
Embracing reproducible practices is more than a technical shift; it’s an investment in the future. As you embark on this journey, remember that every effort counts. Each new workflow, each training session, and each documented analysis brings your institution closer to a culture of clarity, agility, and insight. This is the opportunity to elevate your institution’s data capabilities — one step at a time. Start now, and watch the transformation unfold.
7 Appendix: Software (open source and free or low cost)
In this appendix, we provide a list of recommended software tools that are open-source or available at low cost, making them accessible options for colleges of any size. These tools cover a range of needs, from data analysis and visualization to database management and data storage. Each tool is widely used in the data science and analytics community, offering powerful capabilities without requiring a large investment. With the right combination of these tools, institutions can create reproducible workflows that enhance efficiency, improve data quality, and empower staff to perform advanced analyses.
- R6: A powerful programming language used primarily for statistical analysis, data manipulation, and visualization, offering a wide range of packages for advanced analytics.
- RStudio7: An integrated development environment (IDE) for
Rthat provides tools to help users write, test, and publishRcode with ease. - tidyverse8: A collection of
Rpackages designed for data science, making it easier to import, tidy, transform, and visualize data. - ggplot29: An
Rpackage for creating data visualizations, using a layered approach to make complex plots more accessible. - Quarto10: A publishing system for creating documents, presentations, and reports from
R, Python, and other languages, supporting dynamic content and reproducibility. - Shiny11: An
Rpackage that makes it easy to build interactive web applications directly from R.
- RStudio7: An integrated development environment (IDE) for
- Python12: A versatile programming language popular in data science, analytics, and machine learning.
- Jupyter Notebooks13: An open-source web application for creating and sharing documents that contain live code, equations, visualizations, and text.
- Plotly14: A Python library for creating interactive graphs and dashboards, well-suited for exploratory data analysis and presentation.
- Matplotlib15: A comprehensive library for creating static, animated, and interactive visualizations in Python.
- Pandas16: A Python package providing fast, flexible, and expressive data structures for data analysis, particularly useful for data cleaning and manipulation.
- Numpy17: A foundational package for scientific computing with Python, providing support for large, multi-dimensional arrays and matrices.
- Data storage
- PostgreSQL18: A powerful, open-source relational database management system known for reliability and feature robustness, ideal for managing transaction data.
- Data warehouse
- DuckDB19: An embedded analytical database designed for fast and efficient analytical queries, suitable for desktop applications and smaller data storage needs.
- ClickHouse20: A columnar database management system optimized for online analytical processing, suitable for cloud deployment and high-performance data analysis.
- SQL: The standard language for querying relational databases, forming the backbone of any data pipeline.
8 Appendix: Support
In this appendix, we provide a range of resources designed to support learners at every stage of their data analysis journey. From interactive tutorials and hands-on exercises to full-length courses and in-depth books, these resources cover essential skills in R, Python, statistics, and data science. Whether you’re looking to build a foundation in programming or deepen your understanding of statistical methods, these resources offer accessible, high-quality learning paths that can be tailored to individual needs and learning styles.
8.1 General resources
8.1.1 For R
- RforIR21: A dedicated resource for institutional researchers, offering
Rtutorials and resources tailored to data analysis in educational settings. - codeacademy22: An interactive learning platform offering beginner-friendly courses on
Rprogramming, covering fundamental data analysis skills. - swirl23: An
Rpackage that teachesRprogramming and data science directly in theRconsole, providing interactive, hands-on lessons.
8.1.2 For Python and Jupyter Notebooks
- Real Python24: Offers in-depth tutorials on Python programming, including data analysis and visualization.
8.2 Classes
8.2.1 For R
- R Programming A-Z™:
RFor Data Science With Real Exercises!25: This comprehensive course coversRprogramming fundamentals, data analytics, data science, statistical analysis, and data visualization usingggplot2. It includes practical exercises to reinforce learning. (udemy) - Data Science: Foundations using
RSpecialization26: Offered by Johns Hopkins University, this specialization introduces foundational data science tools and techniques, includingRprogramming, data cleaning, and exploratory data analysis. (Coursera) RProgramming27: Also from Johns Hopkins University, this course focuses onRprogramming essentials, covering topics like data types, functions, and debugging, aimed at building a solid foundation in R. (Coursera)RProgramming Fundamentals28: This track offers a series of courses designed to teachRprogramming from the ground up, including data manipulation, visualization, and writing efficientRcode. (DataCamp)
8.2.2 For Python
- Coursera: Python for Data Science29: A popular course for learning data analysis in Python, including Jupyter Notebook usage.
- Udacity: Data Analyst Nanodegree30: Focuses on data wrangling, visualization, and analysis using Python and Pandas.
- edX: Analyzing Data with Python31: Covers Python data analysis libraries, including Pandas, Matplotlib, and Seaborn.
- Kaggle Learn32: A free resource with interactive courses focused on Python for data science and machine learning.
- Dataquest33: Provides structured, project-based lessons on Python, Jupyter Notebooks, and data analysis.
- Google’s Python Class34: A free, beginner-friendly resource that covers Python fundamentals and data analysis basics.
8.3 Free books
8.3.1 On R
Rfor Data Science35: This foundational text teaches essential data science skills usingR, focusing on data manipulation, visualization, and modeling with the tidyverse package.- Modern Data Science with
R36: Designed for a wide range of data science tasks, this book covers data wrangling, visualization, and modeling, integrating real-world applications andRprogramming. - R Graphics Cookbook37: A practical guide to creating a variety of data visualizations in
R, providing recipes for effective and customizable graphics with ggplot2. - Statistical rethinking (2e)38: A Bayesian-focused introduction to statistical modeling in
R, with an emphasis on intuitive understanding and practical applications. - Advanced
R(2e)39: This comprehensive book dives deep into advancedRprogramming techniques, covering topics like functional programming, object-oriented programming, and performance optimization.- Advanced
RSolutions40: A companion resource with detailed solutions to exercises in AdvancedR, ideal for reinforcing and applying advancedRprogramming concepts.
- Advanced
8.3.2 On Python
- Automate the Boring Stuff with Python41: A beginner-friendly book that covers practical Python skills, including data handling and analysis.
- Python for Data Science Handbook42: A comprehensive guide to data science with Python, covering essential tools like Jupyter, Pandas, NumPy, and Matplotlib.
- Think Python43: An introduction to Python programming that covers foundational skills applicable to data science.
- Python for Data Analysis44: Written by the creator of Pandas, this book covers data manipulation and analysis techniques in Python.
- From Python to NumPy45: An introduction to NumPy concentrating on the migration from Python to NumPy through vectorization.
- Scientific Visualization: Python + Matplotlib46: A complete introduction and deep investigation of Matplotlib, a versatile and powerful library that allows you to design very high quality figures, suitable for scientific publishing.
8.4 Free books on Statistics
8.4.1 Just statistics
- StatQuest47: A video-based introduction to a wide range of statistics topics.
8.4.2 Focused on R
- Statistical Inference via Data Science48: This approachable text introduces statistical inference concepts through hands-on data science applications, making complex ideas accessible to beginners.
- Learning Statistics with
R49: A practical guide for learning statistics, this book combines clear explanations with exercises inRto help readers apply statistical methods in real-world scenarios. - Beyond Multiple Learning Regression50: Expanding on foundational regression techniques, this book explores advanced topics in regression analysis, including generalized linear models, with applications in
R.
8.4.3 Focused on Python
- Foundations of Data Science51: Written by Avrim Blum, John Hopcroft, and Ravindran Kannan, this book provides an introduction to key concepts in data science and statistics, with exercises and examples using Python.
- Think Stats: Exploratory Data Analysis in Python52: A beginner-friendly book by Allen B. Downey that covers statistical thinking and data analysis using Python, with practical exercises and applications.
- Learning Statistics with Python53: A very accessible statistics book based on the book using
Rwith the same name above.
Footnotes
“The Future Workplace Depends on Efficiency, Effectiveness, and Balance”, by Robert Hooijberg and Michael Watkins, MIT Sloan Management Review, June 16, 2022, https://sloanreview.mit.edu/article/the-future-workplace-depends-on-efficiency-effectiveness-and-balance/.↩︎
“Business Analytics: What it is and why it’s important”, by Matt Gavin, HBS Online, July 16, 2019, https://online.hbs.edu/blog/post/importance-of-business-analytics.↩︎
“What is Data Science?”, IBM.com, https://www.ibm.com/topics/data-science.↩︎
“A manifesto for reproducible science”, by Munafò, M., Nosek, B., Bishop, D. et al., in Nature Human Behavior, volume 1, 0021 (2017). Available at https://doi.org/10.1038/s41562-016-0021.↩︎
Reproducibility and Replicability in Science. Washington (DC): National Academies Press (US); 2019 May 7. Chapter 3: “Understanding Reproducibility and Replicability”. Available from: https://www.ncbi.nlm.nih.gov/books/NBK547546/.↩︎
https://www.coursera.org/specializations/data-science-foundations-r↩︎
https://app.datacamp.com/learn/skill-tracks/r-programming-fundamentals↩︎
https://www.udacity.com/course/data-analyst-nanodegree–nd002↩︎
https://www.edx.org/learn/python/ibm-analyzing-data-with-python↩︎
https://github.com/rougier/from-python-to-numpy/tree/master↩︎